How do I use Ahrefs’ site explorer?
Within Ahrefs’ performance report, there are many different things to find. Mainly on link building and (you guessed it) performance. In this article, I talk more about how I interpret and deploy this data within a project.
Performance/link building
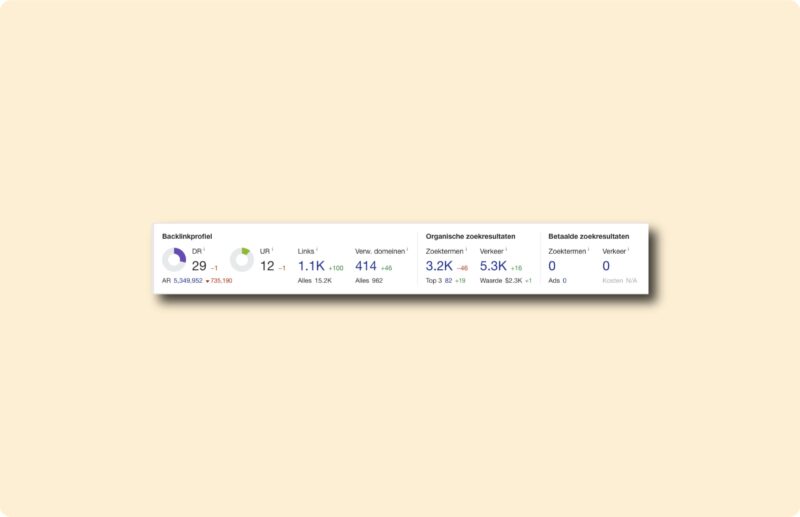
Perhaps the most important thing about this overview is that it provides a quick look at how organic traffic to the Web site is progressing. See the image below for this overview. By the way, I also use this 80% of the times I put a website in there. I explain what it means for each section.
This is purely about the first view when you use the site explorer from Ahrefs. Not the underlying possibilities. From left to right.
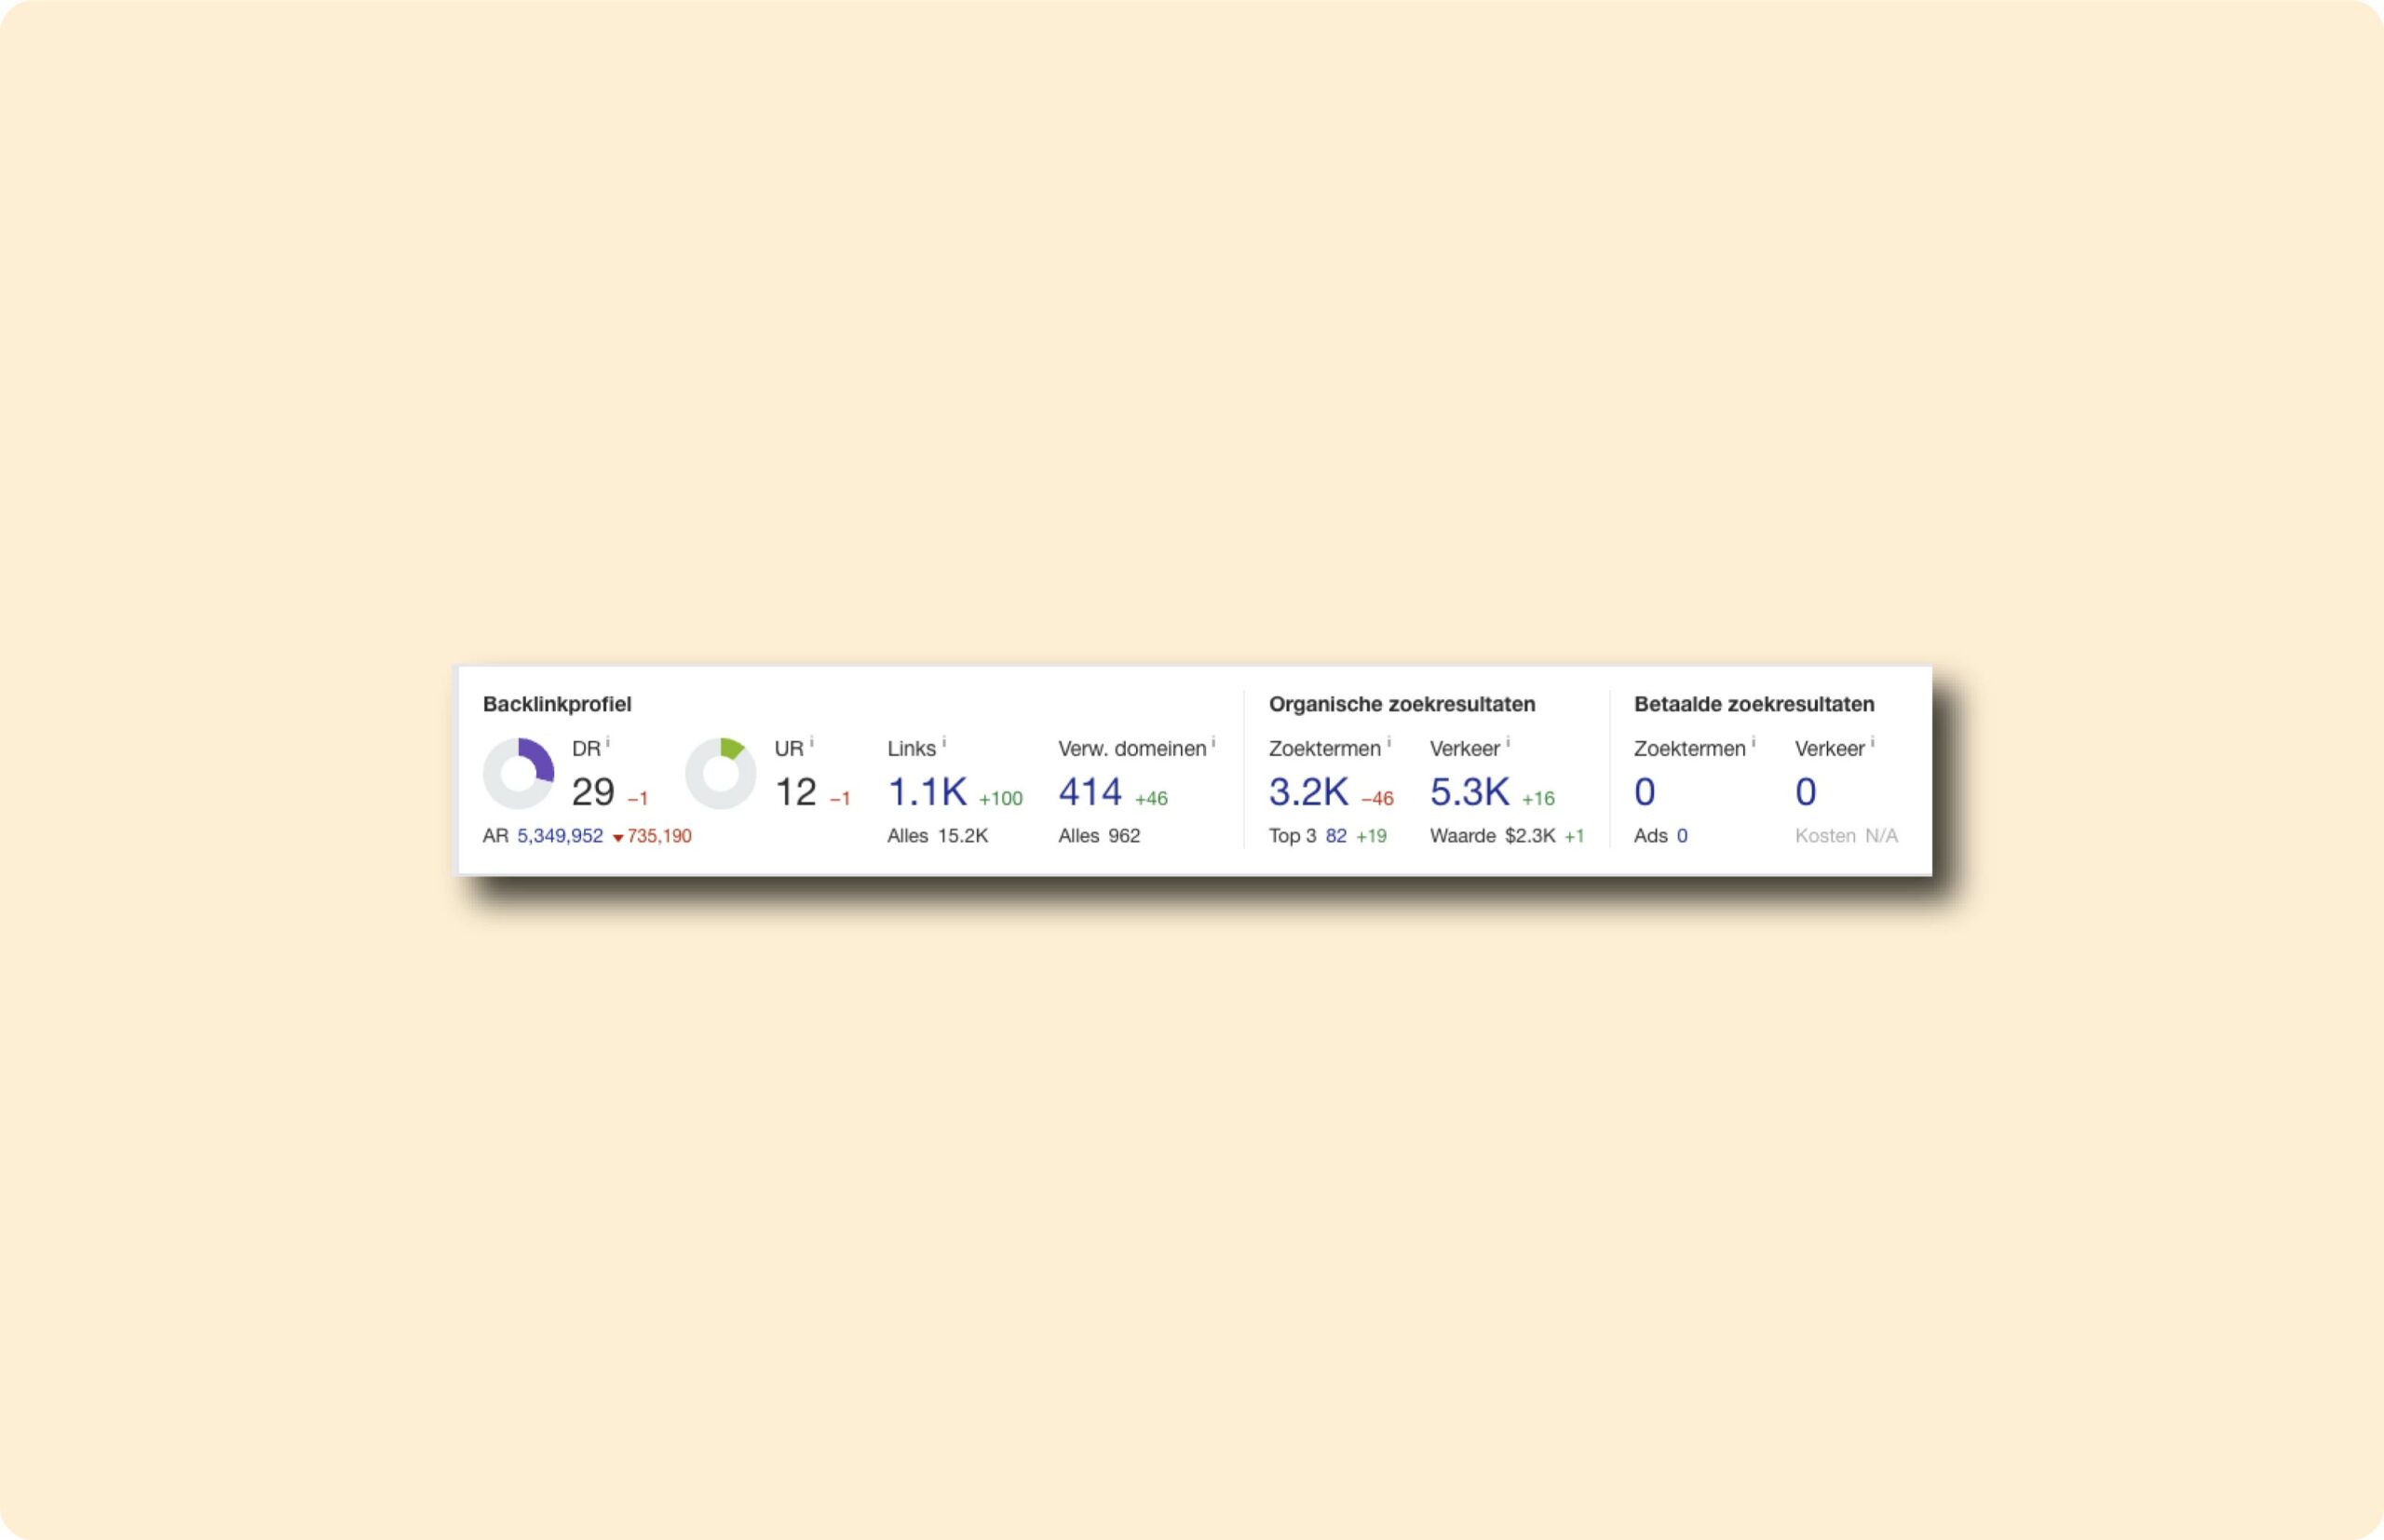
- DR is the Domain Rating. In short: The quality x quantity of the backlink profile (sitewide).
- UR is the URL Rating. In short: The quality x quantity of the backlink profile and internal links to a specific page. The home page is highest 9 times out of 10.
- Links is the total number of link entries to a Web site.
- Referring domains (more important than links) is the total number of websites with a link to a website.
- Search terms is number of search terms in the top 100.
- Traffic is the number of organic visitors to the website per month. Note that this does not always match reality. Ahrefs uses a proprietary algorithm to determine this and, as an external tool, cannot view a website’s internal data (for example, from the Google Search Console or from Google Analytics).
- Paid search results search terms/traffic is an estimate of the number of purchased search terms from a website and the traffic coming from them. This is particularly interesting to determine where a competitor is actively purchasing search terms.
Even with paid search results, like organic results, this is not always accurate. The biggest thing missing from this data is that it is difficult to determine certain trends. The overview below helps with this.
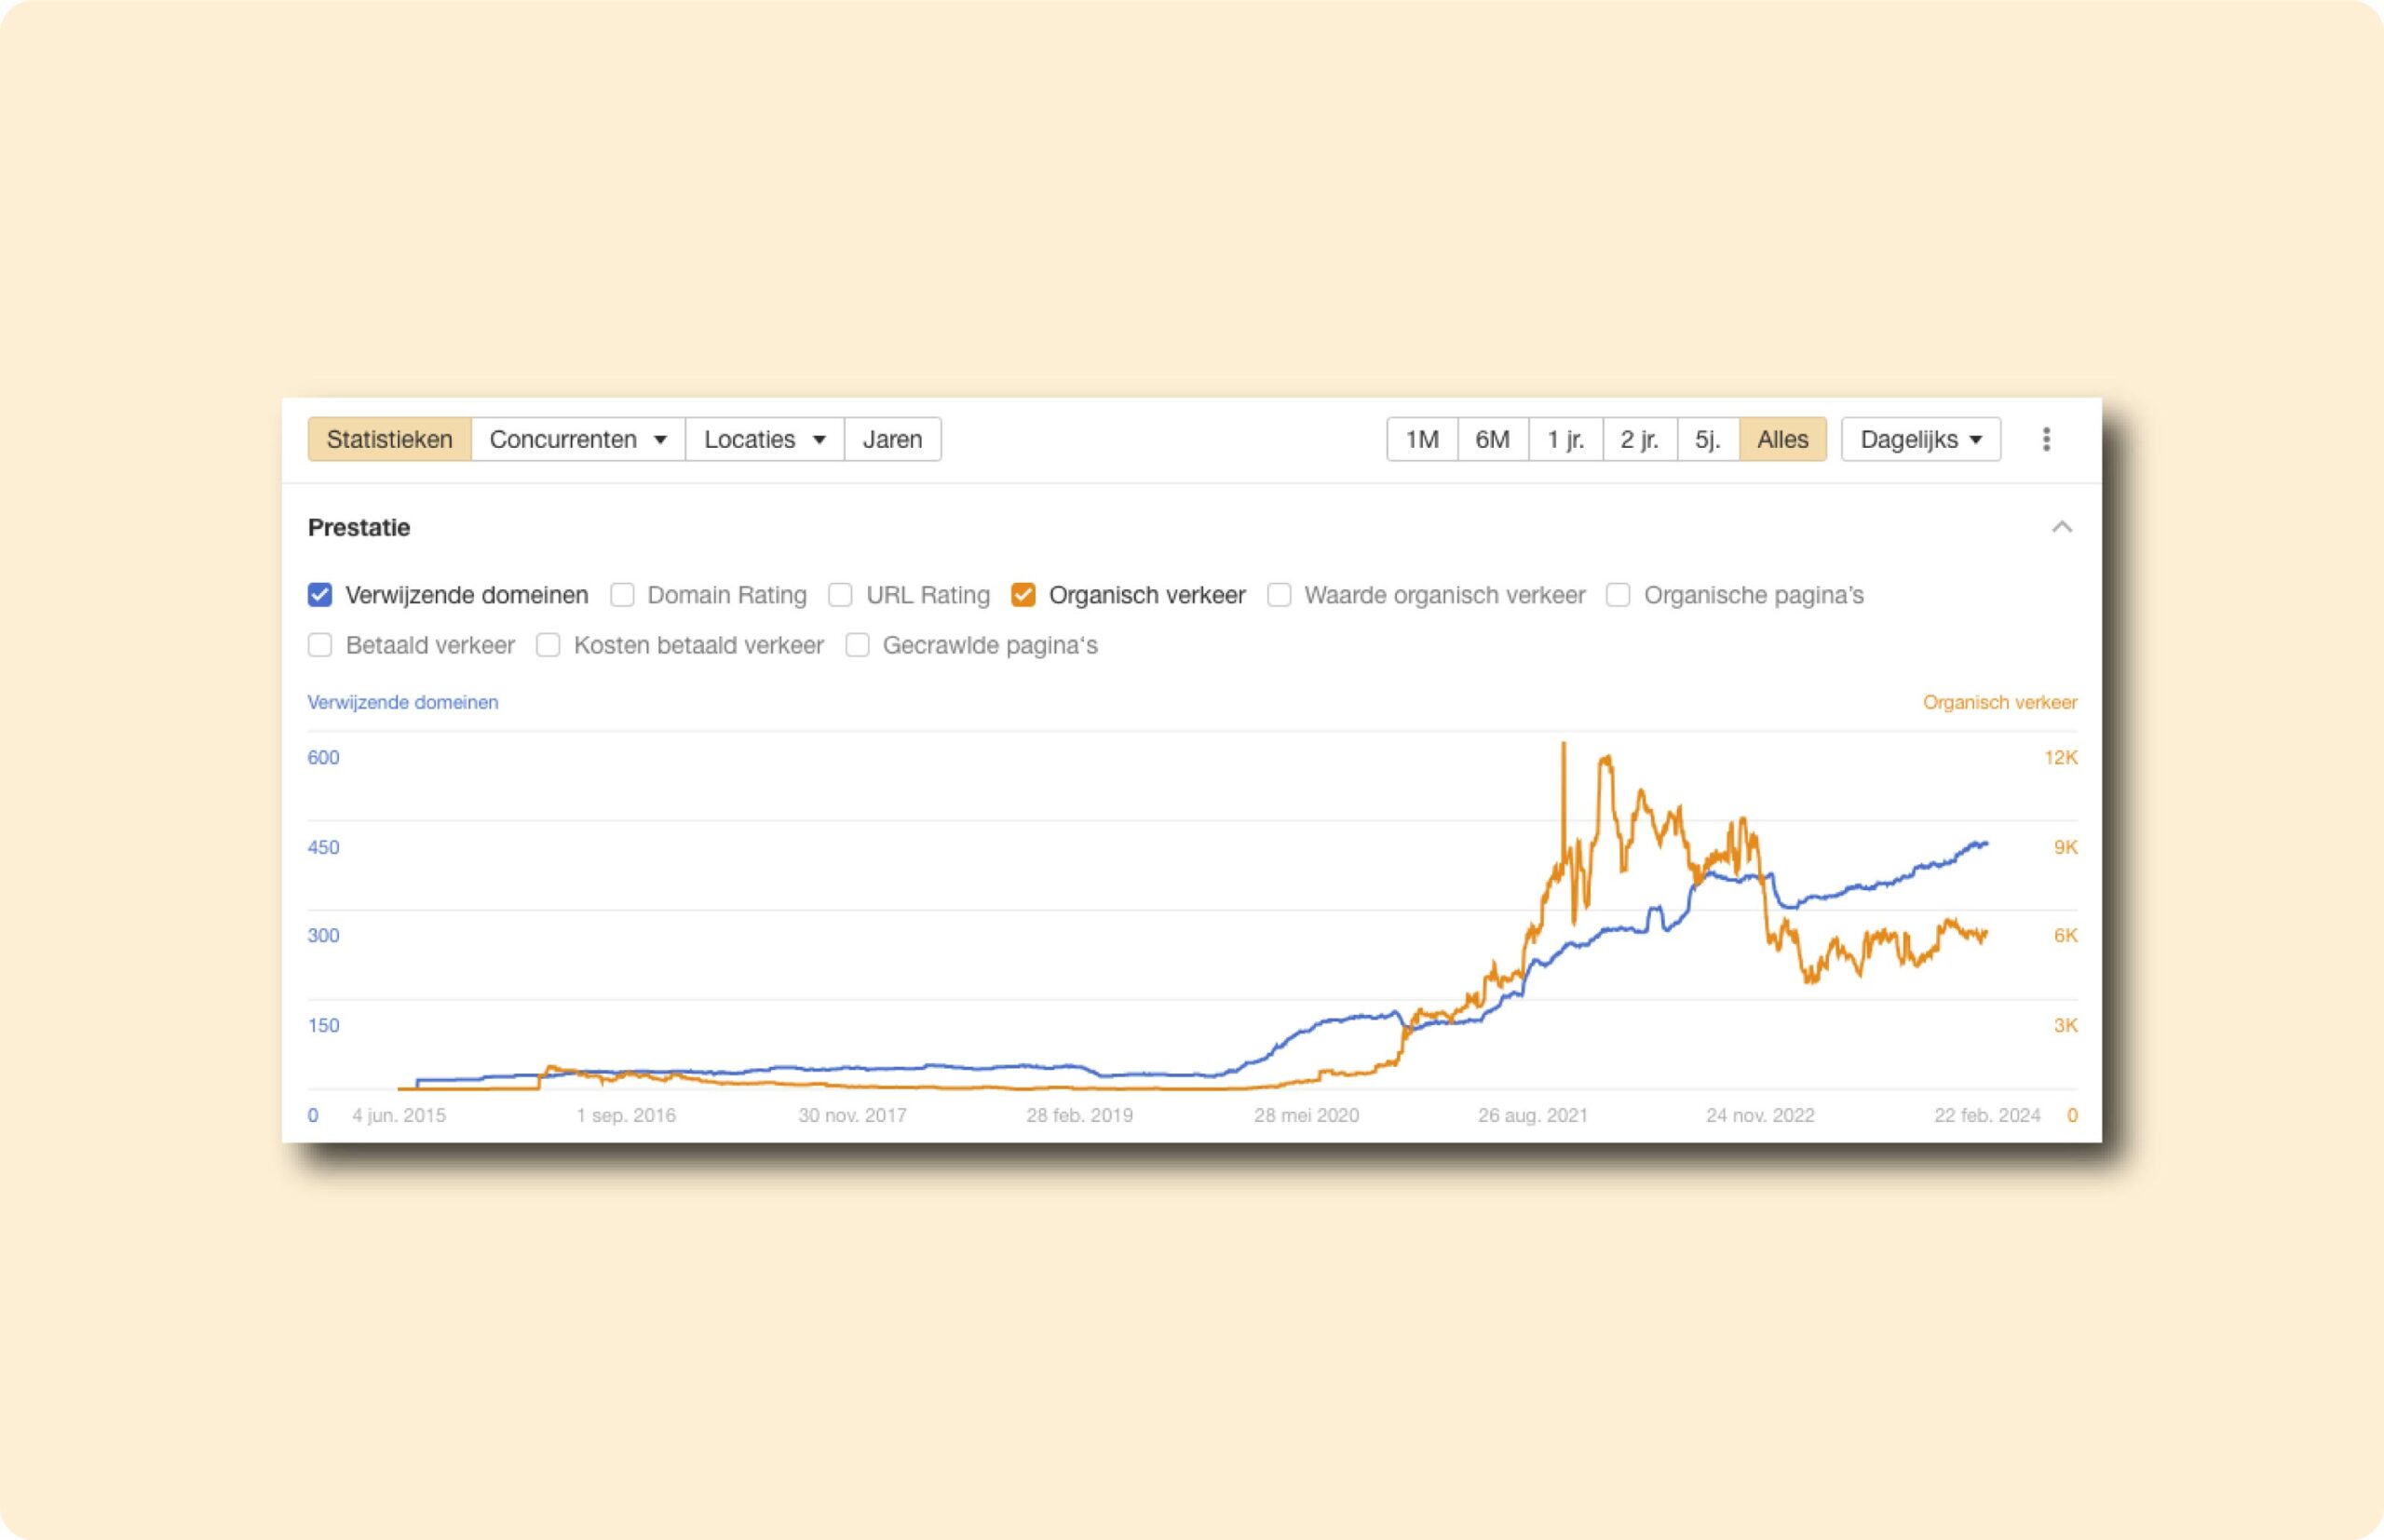
In the top row, you can add the competitors and locations you want to filter by. In doing so, it is possible to view it on a year-by-year basis. Then it looks like the one below.
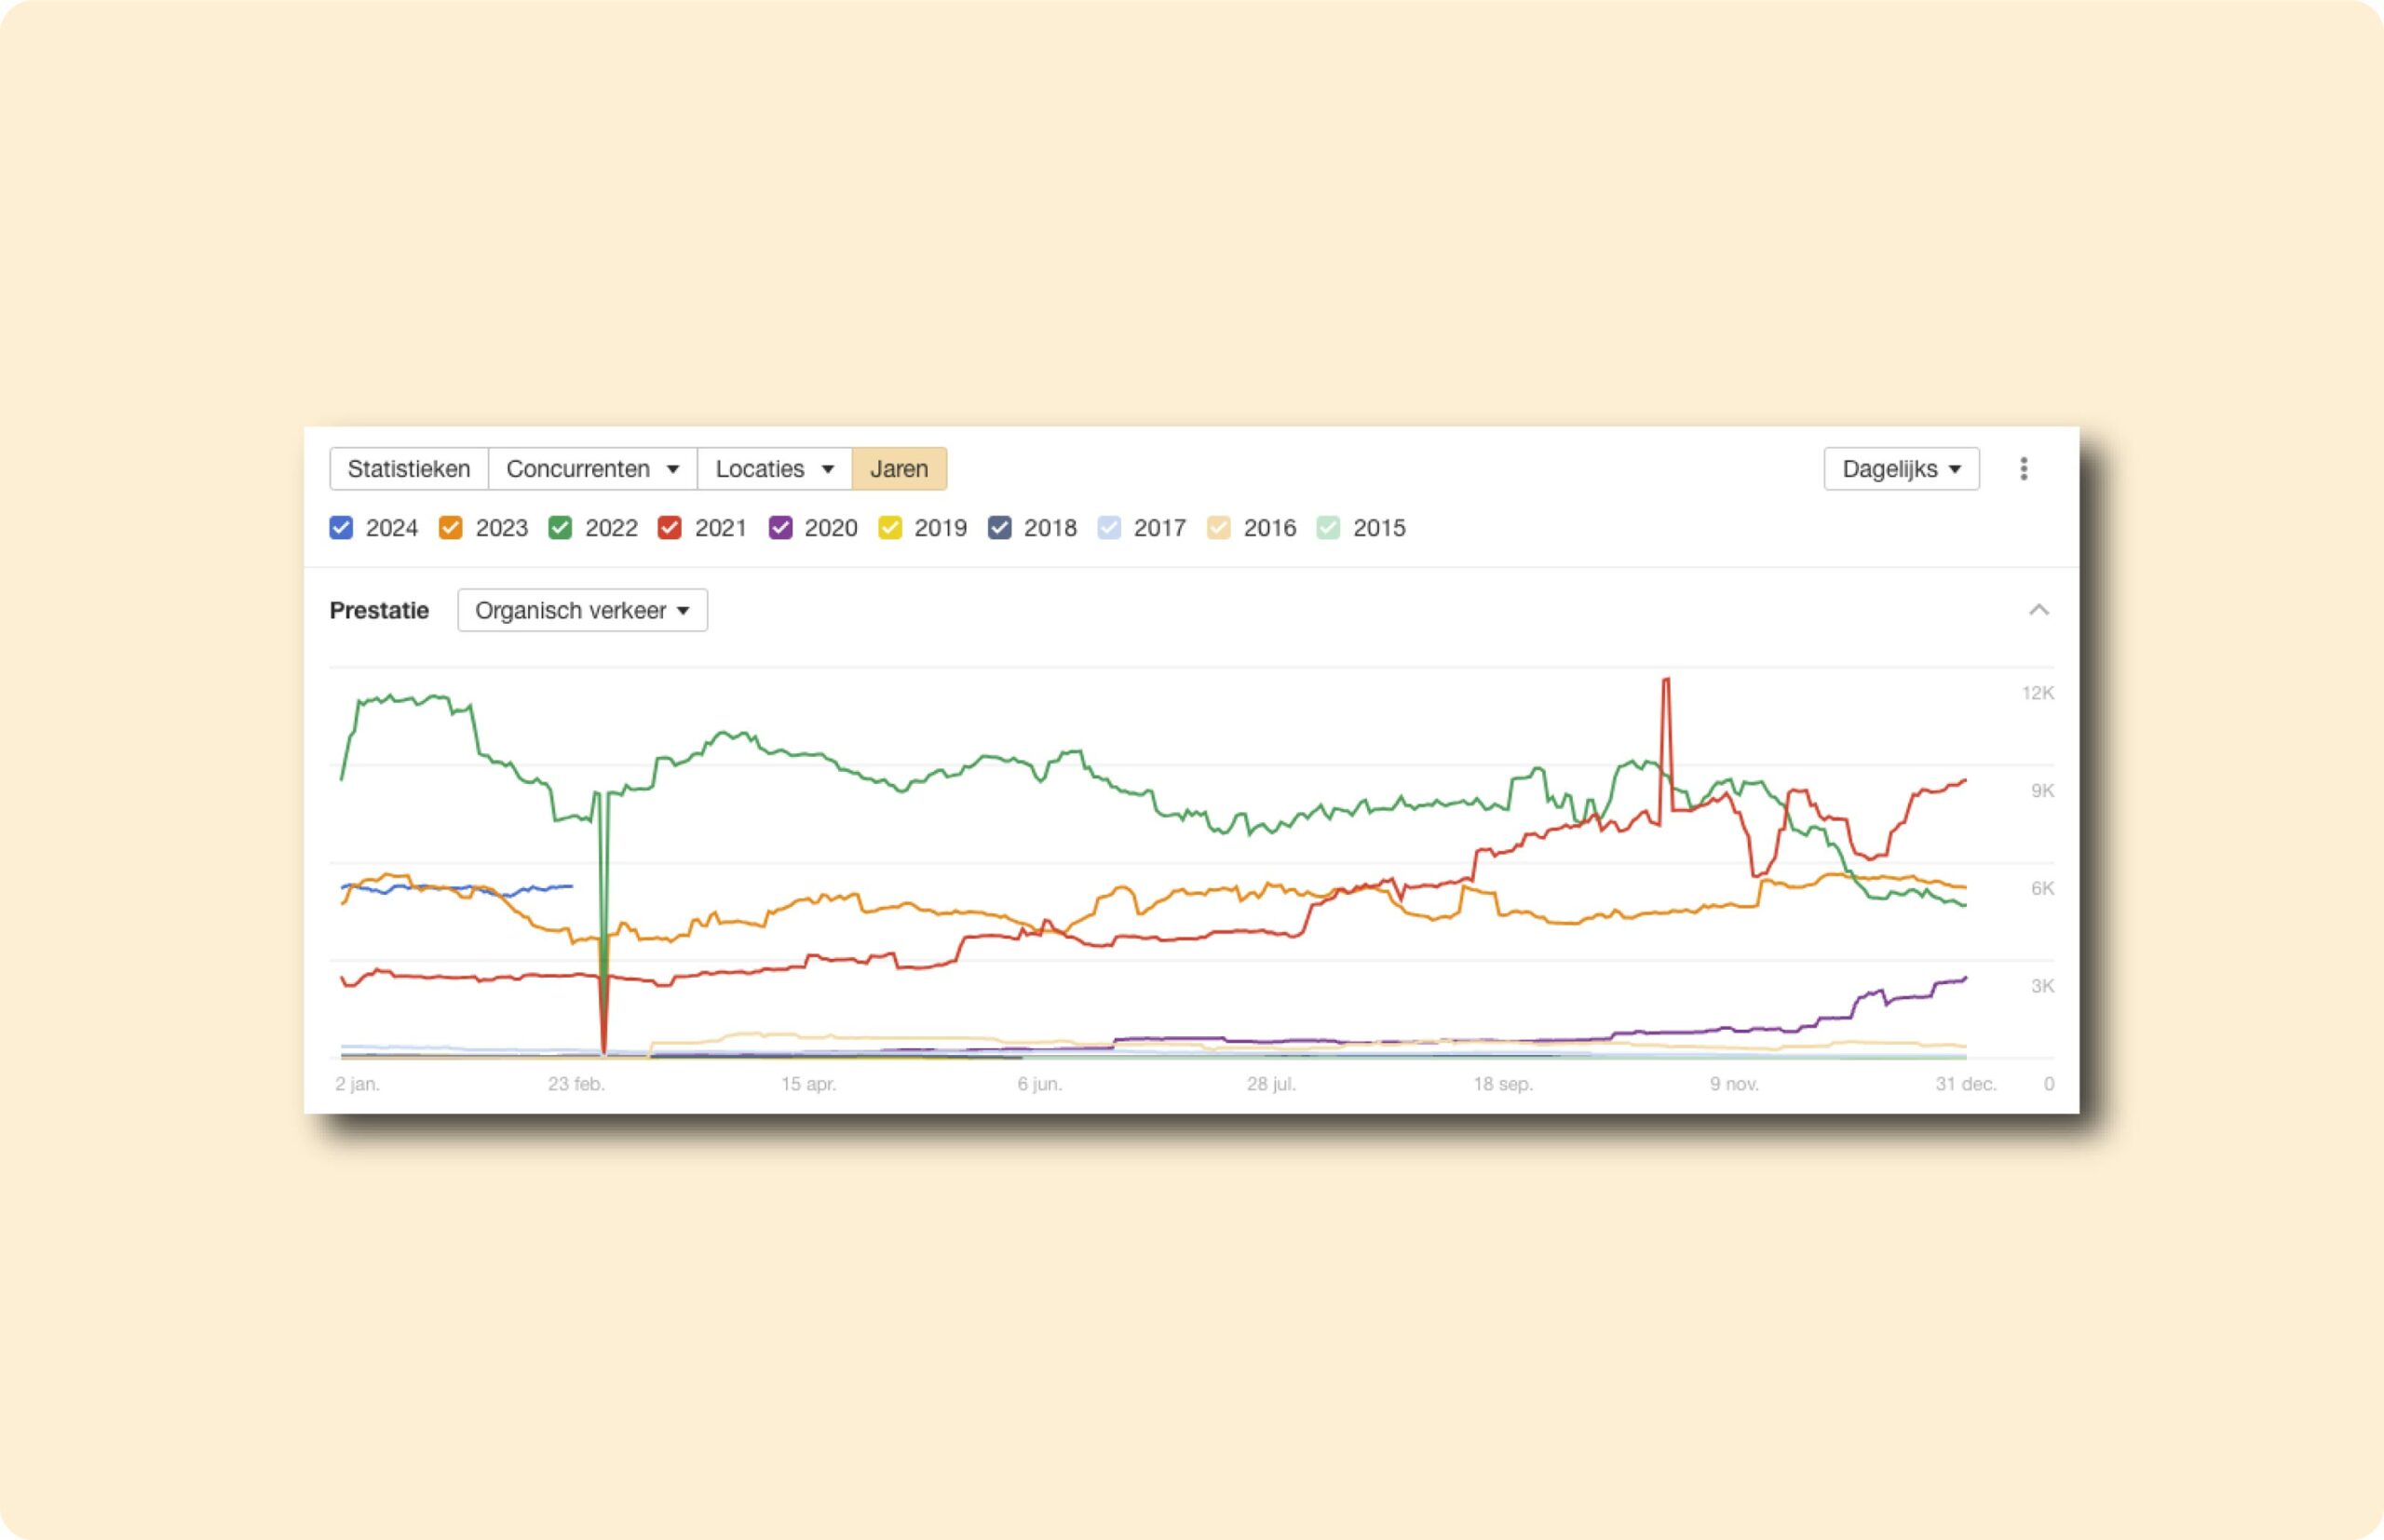
This is particularly useful when you are looking for a report that shows results on an annual basis. In performance, you can see the data in the same way, but for other things such as the number of referring domains, domain rating (progress), URL rating (progress), value of organic traffic, organic pages (number), paid traffic and crawled pages (see image to the right).
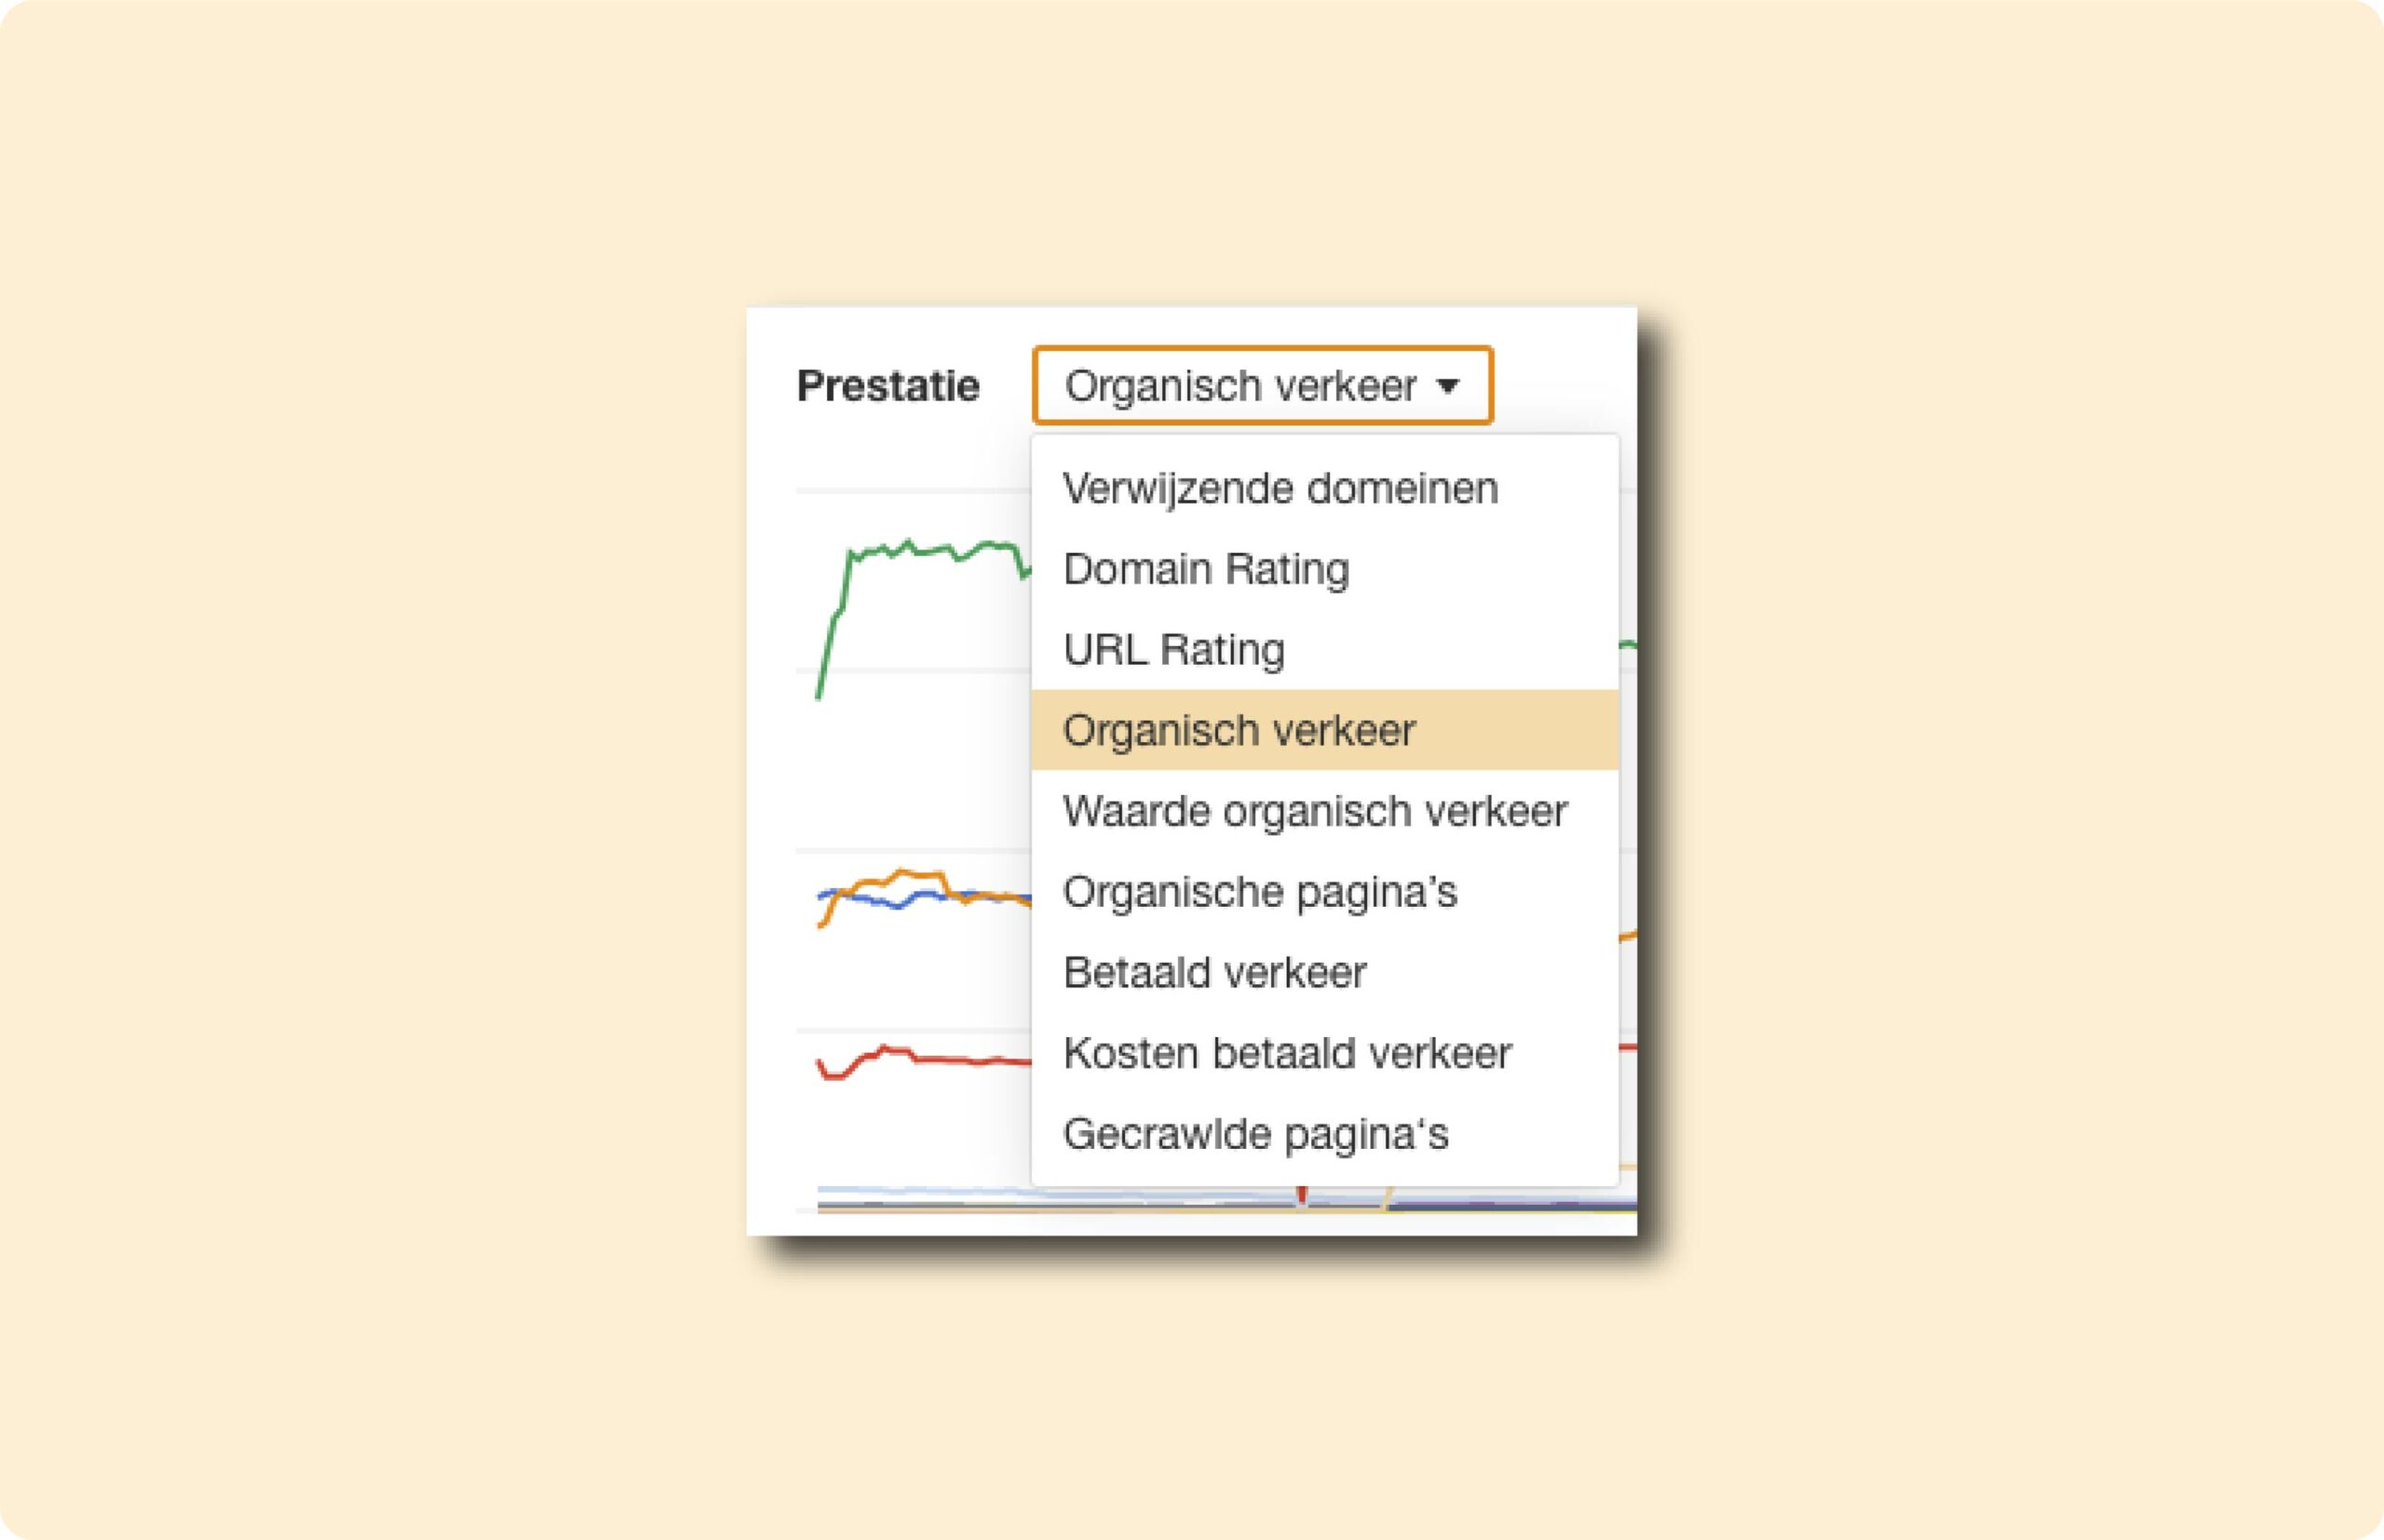
All these filters can be turned on simultaneously in the overview above (statistics). This is what it looks like.
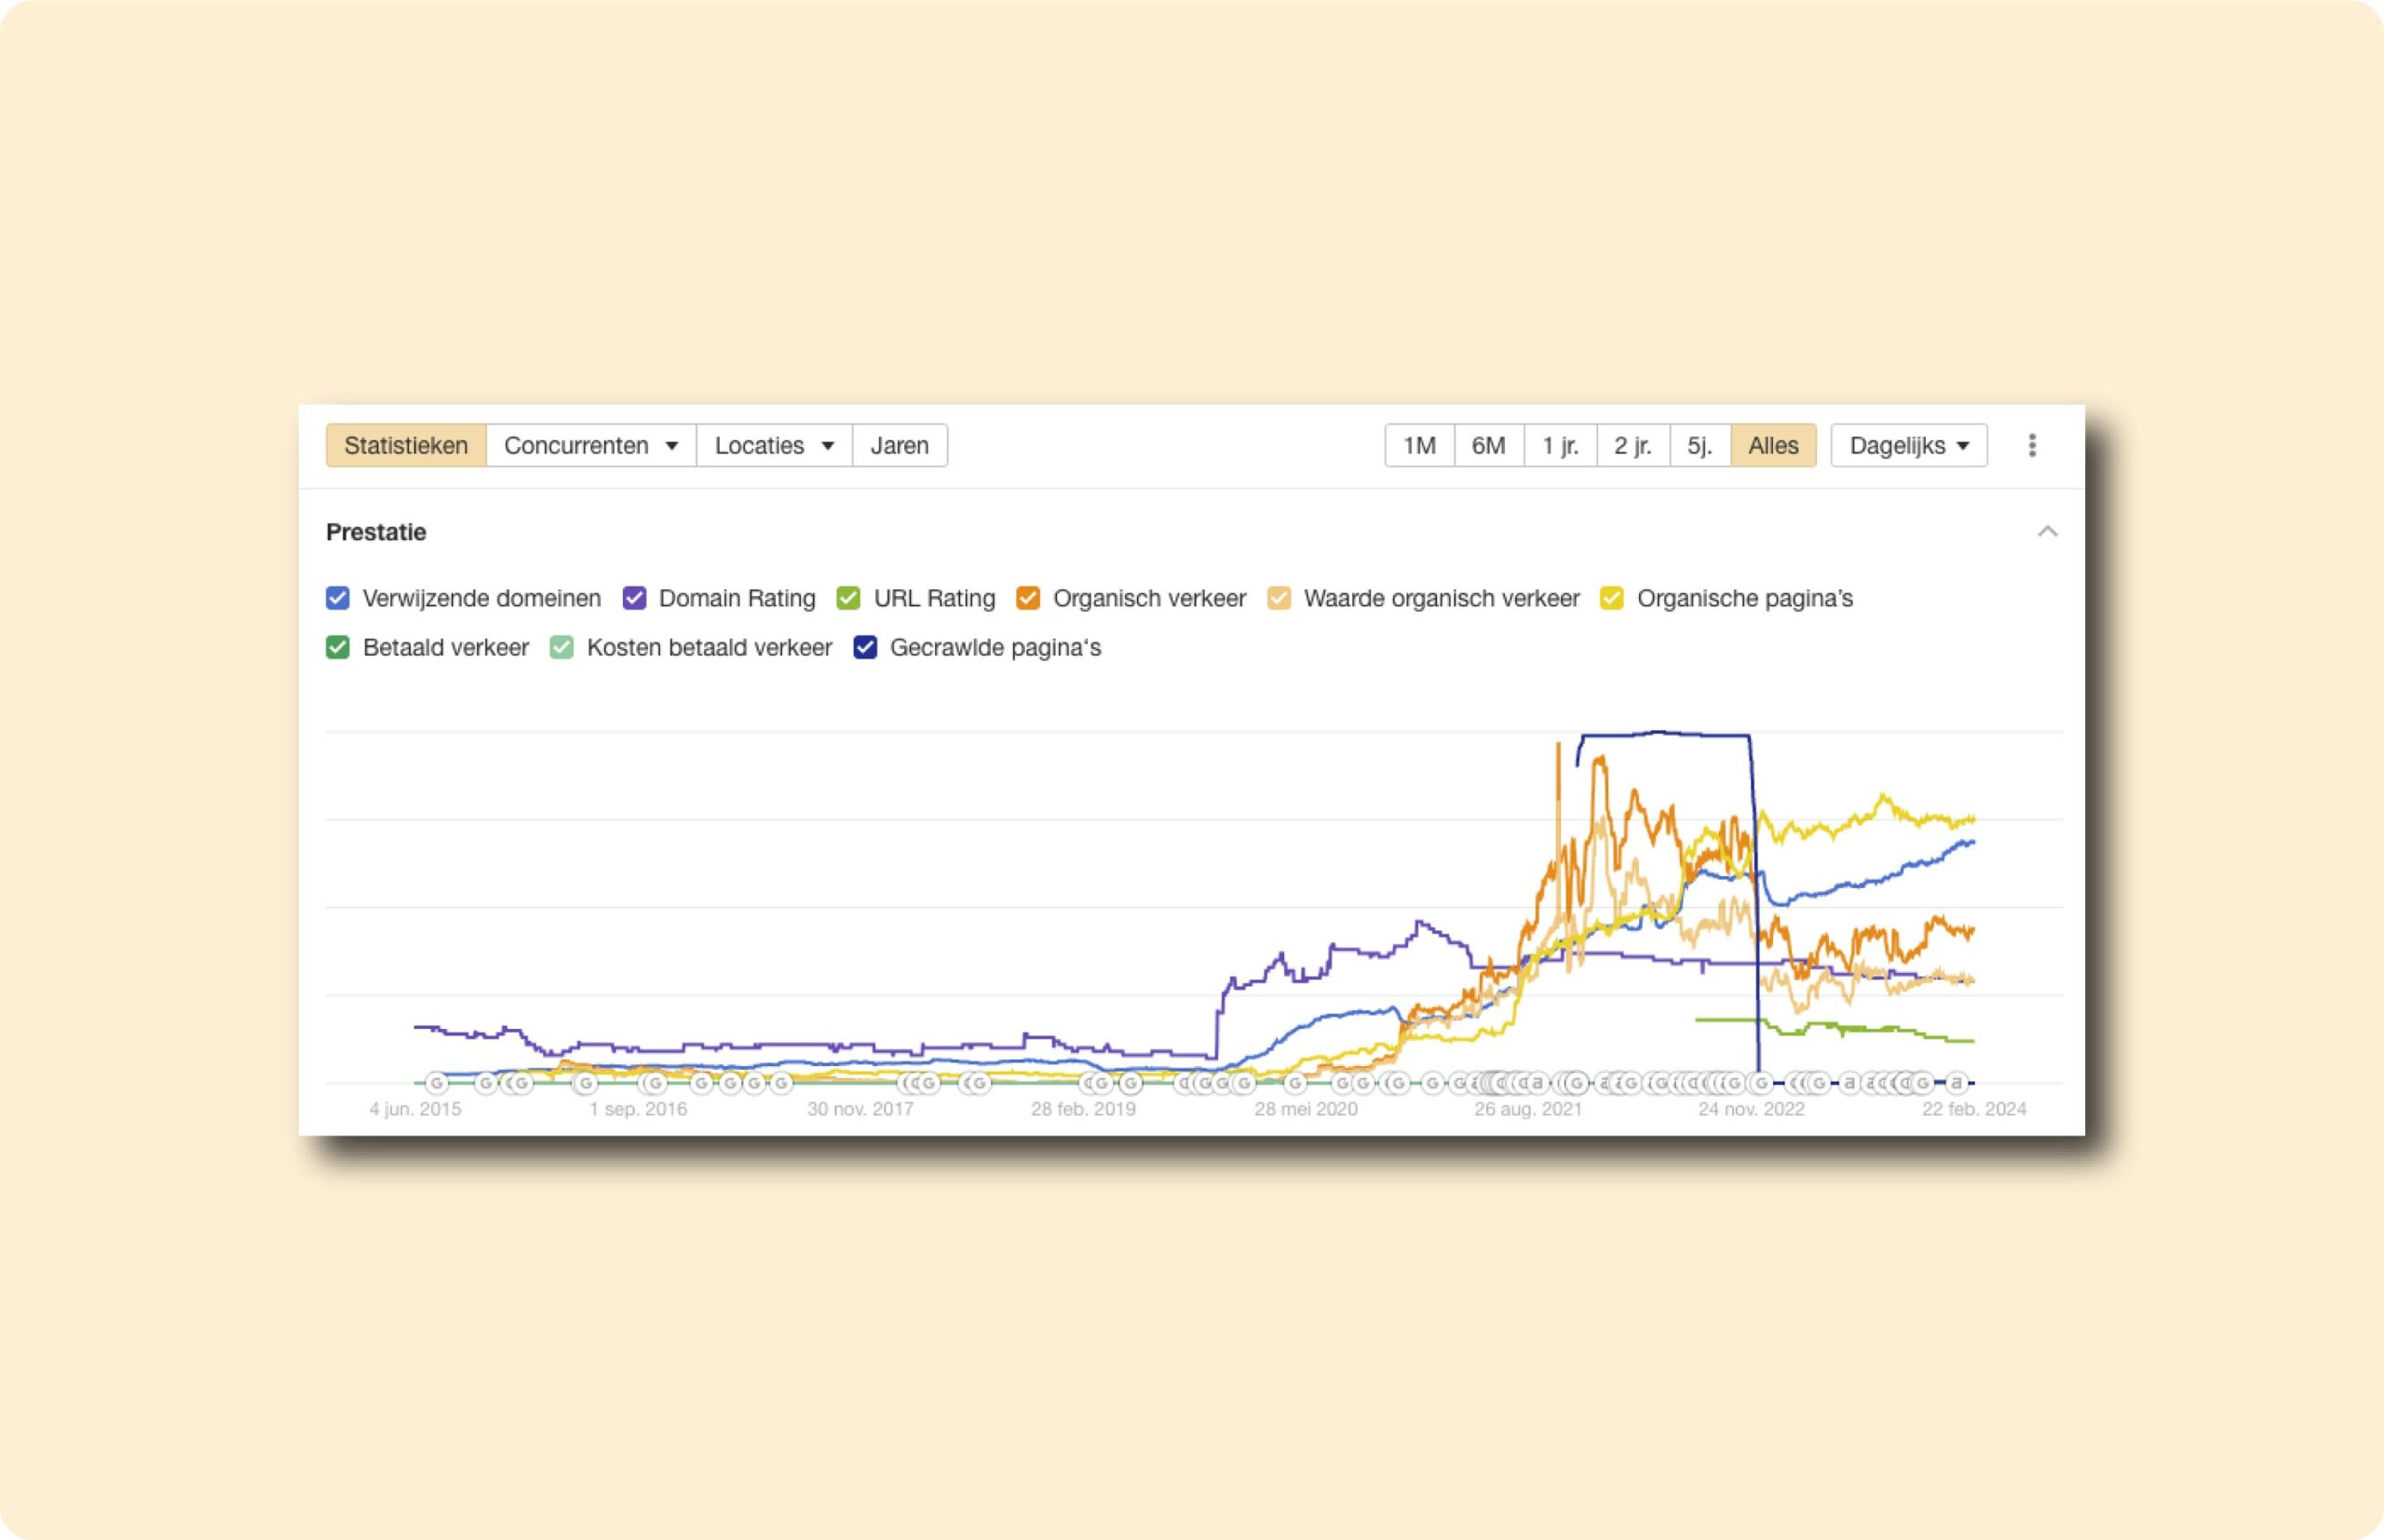
This overview is almost always more convenient than the overview containing the years. What else you can do in this part of the site explorer is:
- Adjust the period (top right)
- Set the gradient (daily, weekly and monthly); this makes it less “bumpy” in the graph.
- Check what you want to view (same options as years).
- The most interesting: You now see logos from Google and Ahrefs at the bottom of the graph. These have been the updates from Google and Ahrefs during this period. It is possible to use the three bullets at the top to add these updates. You can also export this graph here.
Search Terms
In the overview below, you can see the number of search terms in certain ranges.
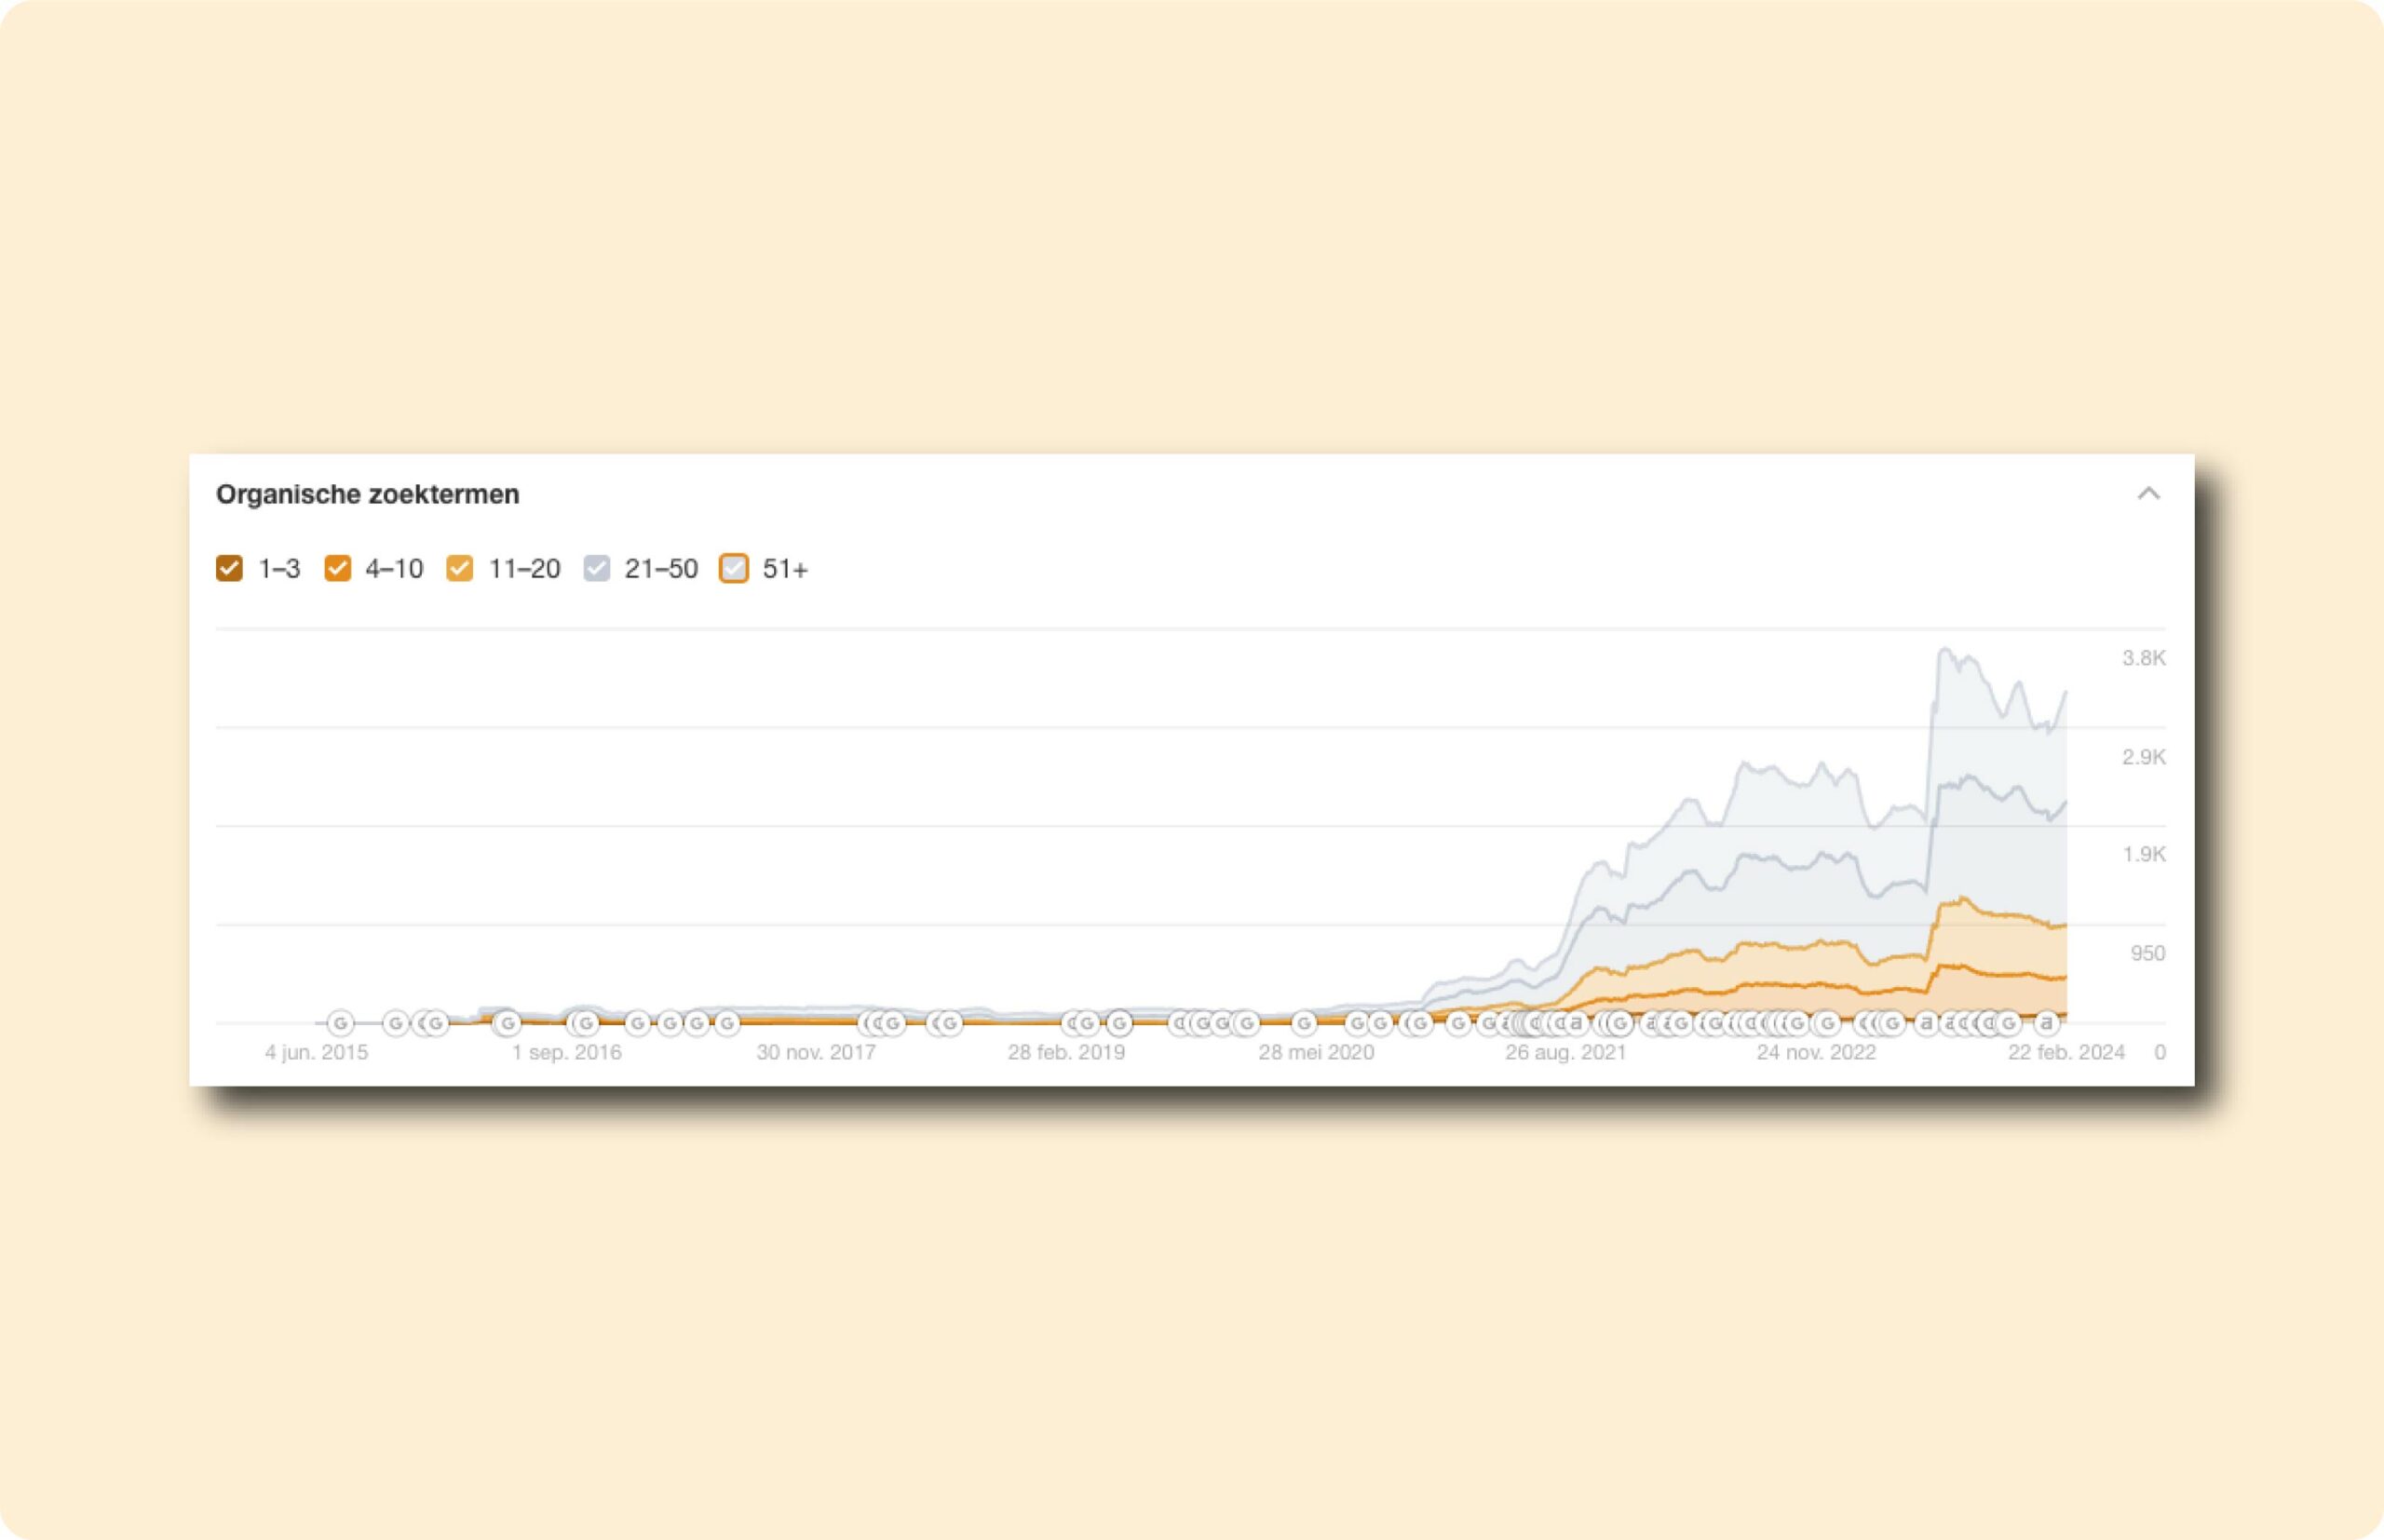
This involves the following ranges:
- Position 1 to 3
- Position 4 to 10
- Position 11 to 20
- Position 21 to 50
- Position 51+
With this overview, I usually look at the progression by section. See the image below for the number of keywords I have a top-3 position with, for example. This makes the progression clearer and the overview easier to understand.
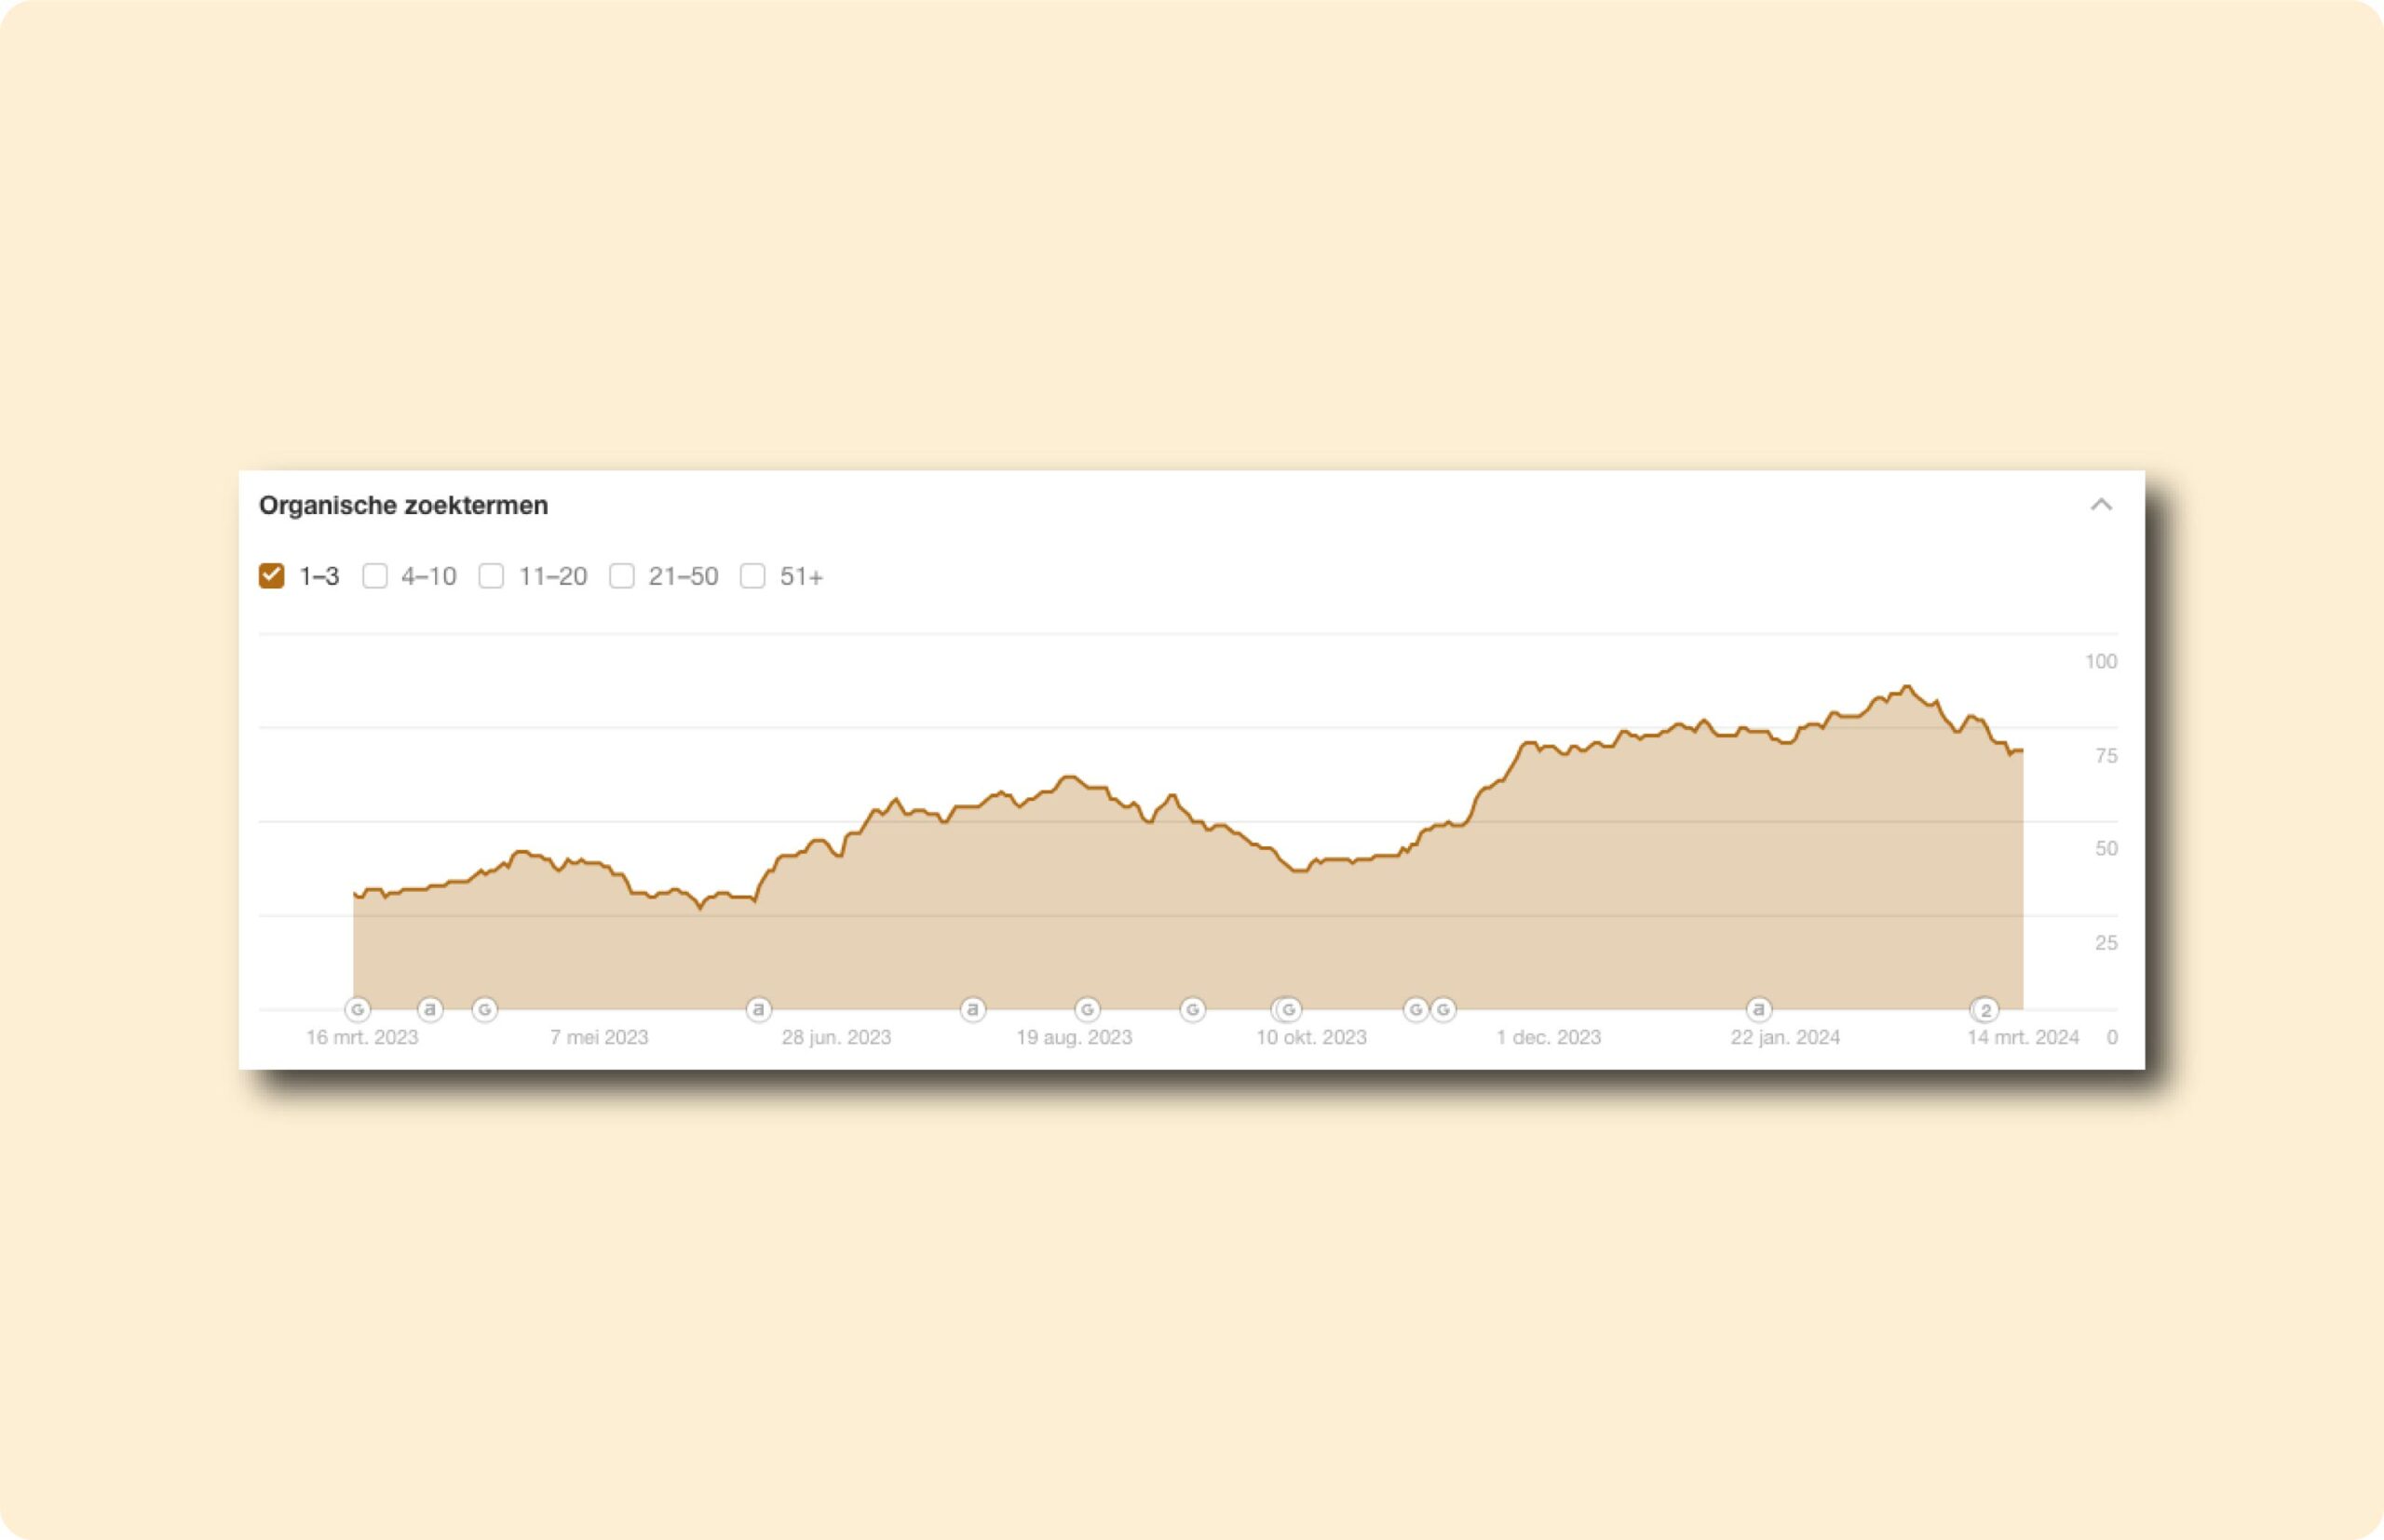
When reporting for a client, I use it as follows:
- Position 1 to 3 –> Very short-term low-hanging fruit.
- Position 4 to 10 –> Short-term low-hanging fruit.
- Position 11 to 20 –> Mid to long-term goals.
- Position 21 to 50 –> Long-term goals.
- Position 51+ –> Future opportunities.
In short, a complete picture of the future. Of course coupled with a logical story with quality information.
Continue reading about Ahrefs?
Continue reading about Ahrefs? Check out all my articles below about how I use Ahrefs on a daily basis for my clients.
- Determine competitive pressure through SEO/Ahrefs
- What is Domain Rank/Domain Rating?
- Creating a new project in Ahrefs
- What is Ahrefs?
- Creating an account in Ahrefs
- The Ahrefs for SEO guide of 2024
- Creating a content gap analysis in Ahrefs
- The Keywords Explorer from Ahrefs
- Traffic potential is more important than volume
Organic competitors
In this section of the site explorer, it is possible to see a global overview of a domain’s (or specific URL’s) organic competitors. In this case / for this example, I have chosen the entire domain (see overview below).
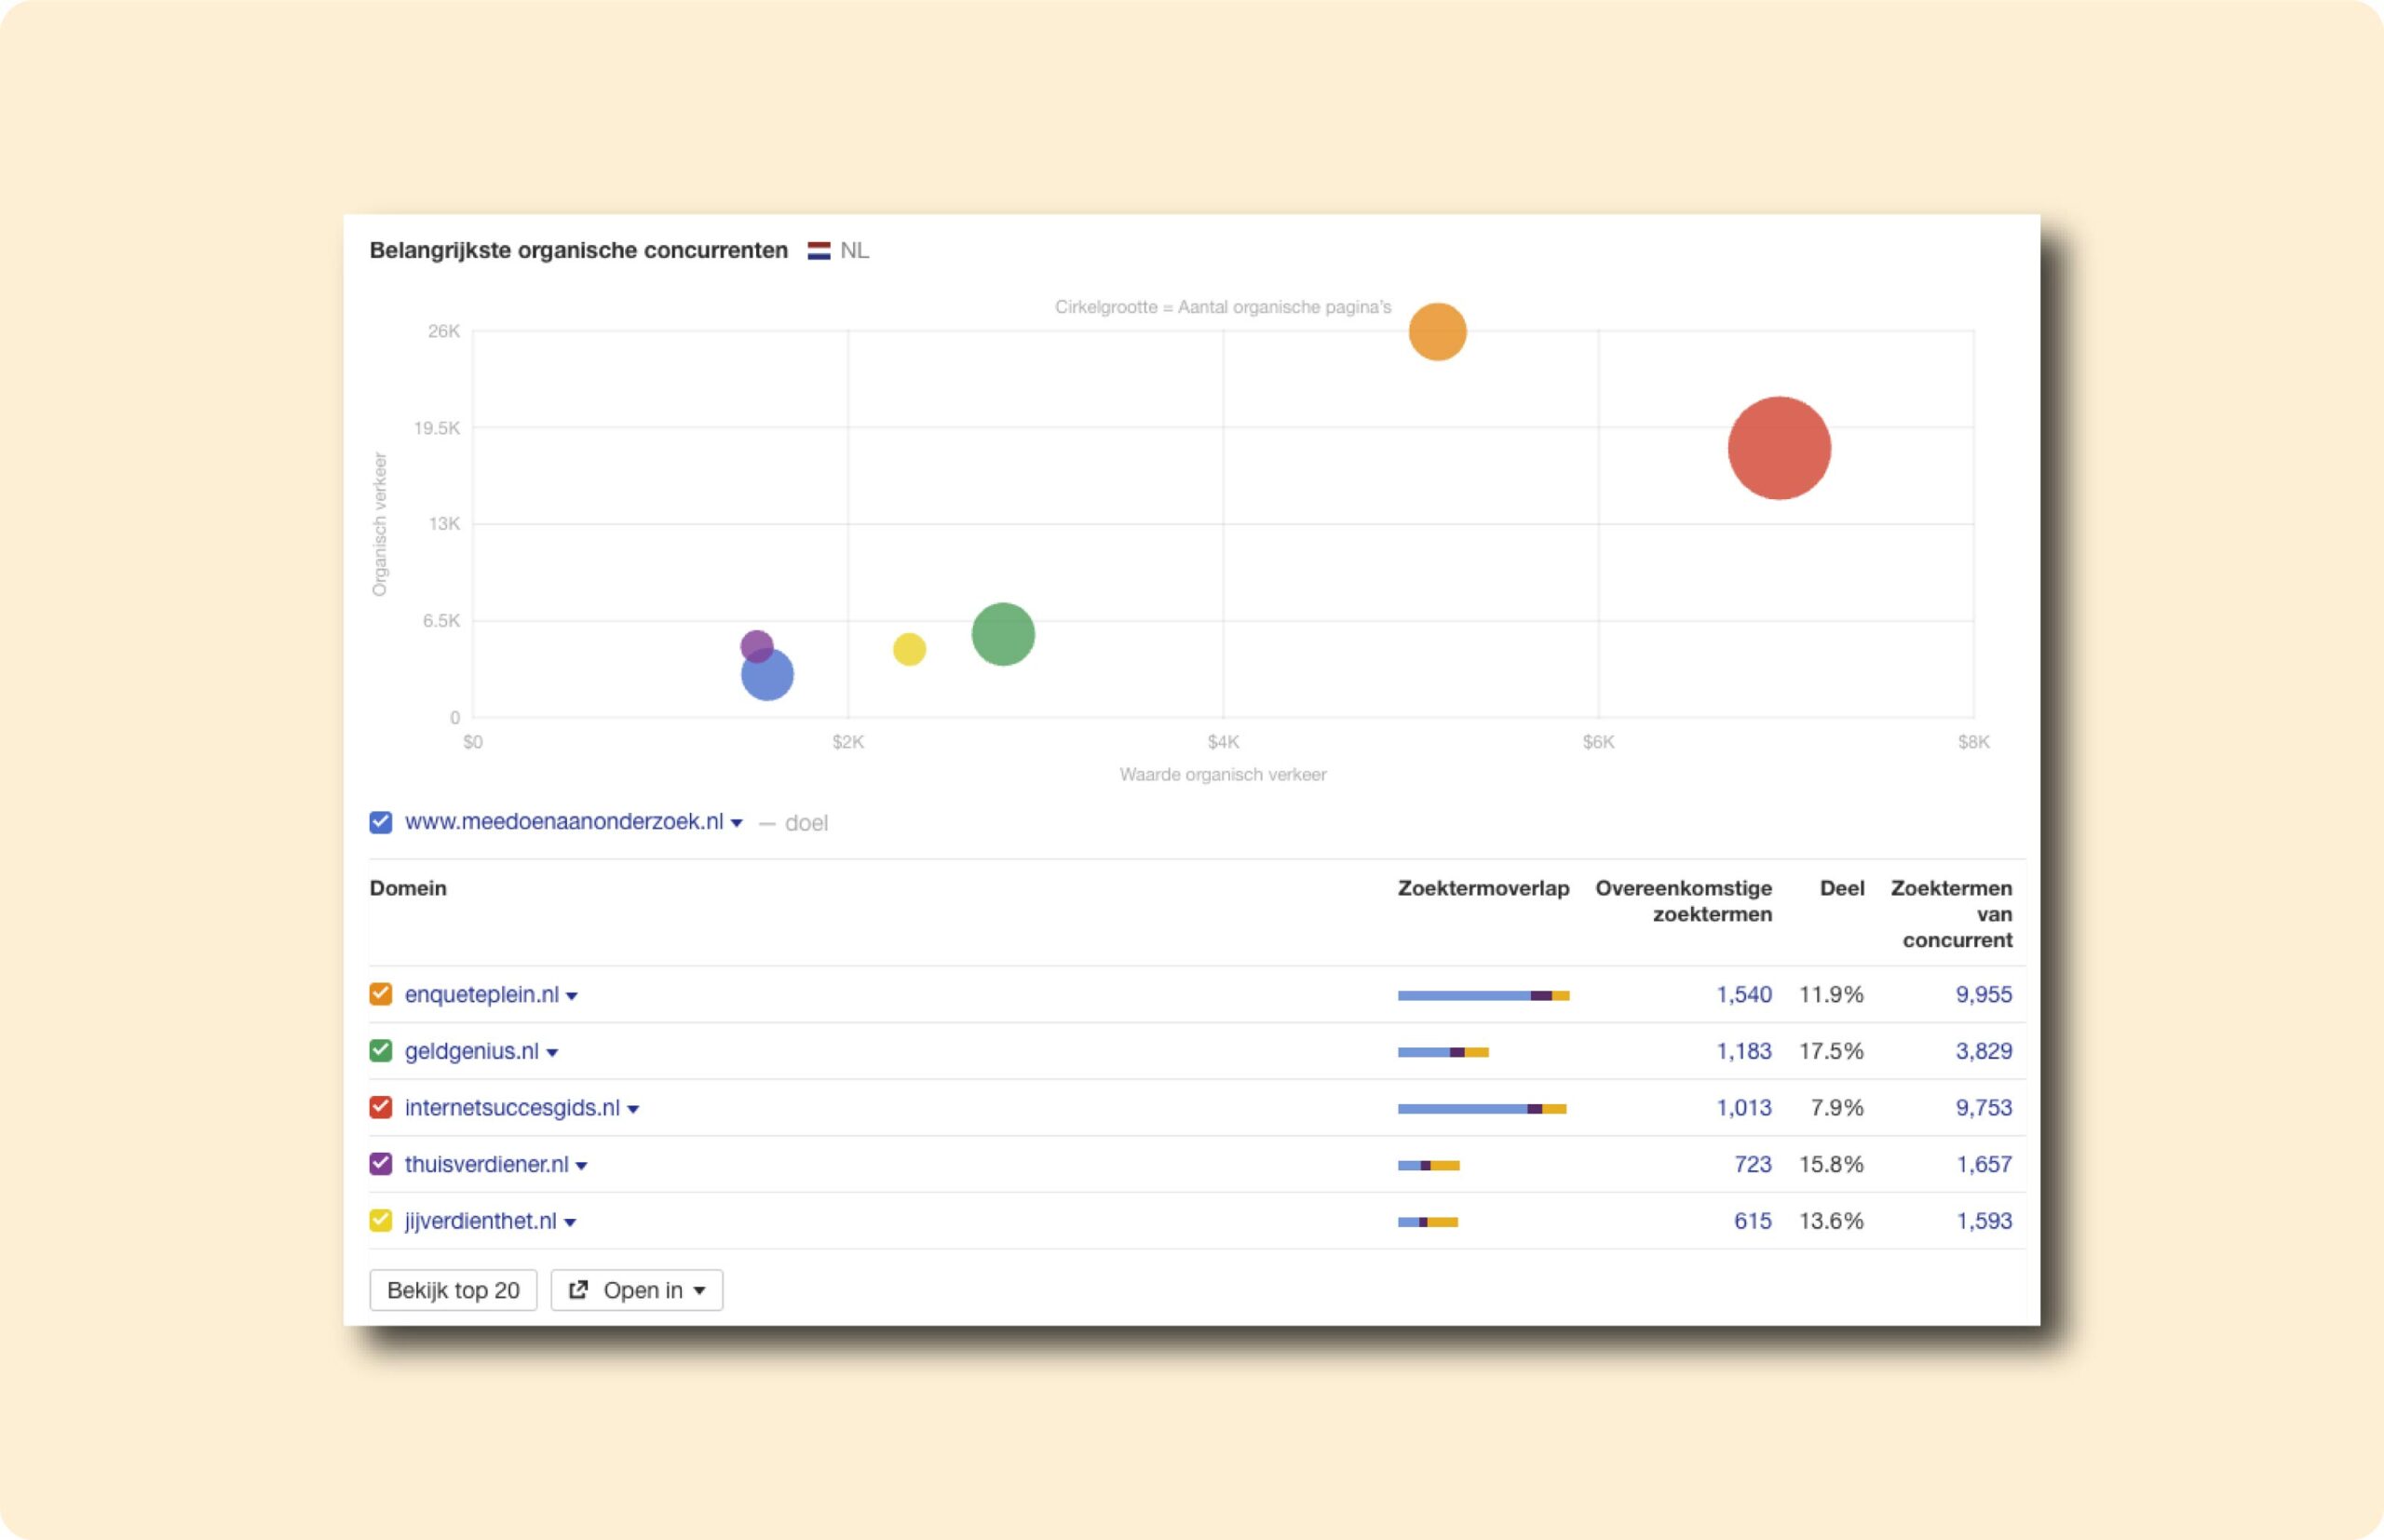
The things that are possible to see in this:
- An overview in a graph showing the number of organic pages and the level of organic traffic per competitor (indicated with dots and colors).
- An overview of competitors including:
- Search term overlap (how many search terms match your domain).
- Corresponding search terms.
- Share (indicated in percent).
- Competitor search terms.
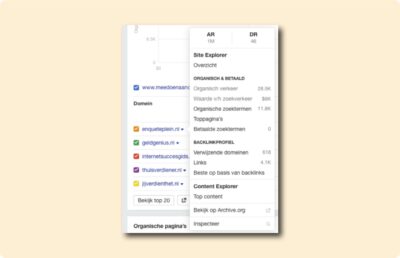
When you click through on a competitor you see:
- Organic traffic
- Value of search traffic
- Organic search terms
- Top Pages
- Paid search terms (Google Ads)
- Referring domains
- Left (total)
- Best based on backlinks (overview of external links)
- Top content (overview of the top pages)
- A link to Archive.org to see the history of the domain
- Inspect (the HTML of the page)
Overview of organic and crawled pages
In the latest Site Explorer view, it is possible to see the organic and crawled pages (see image below).
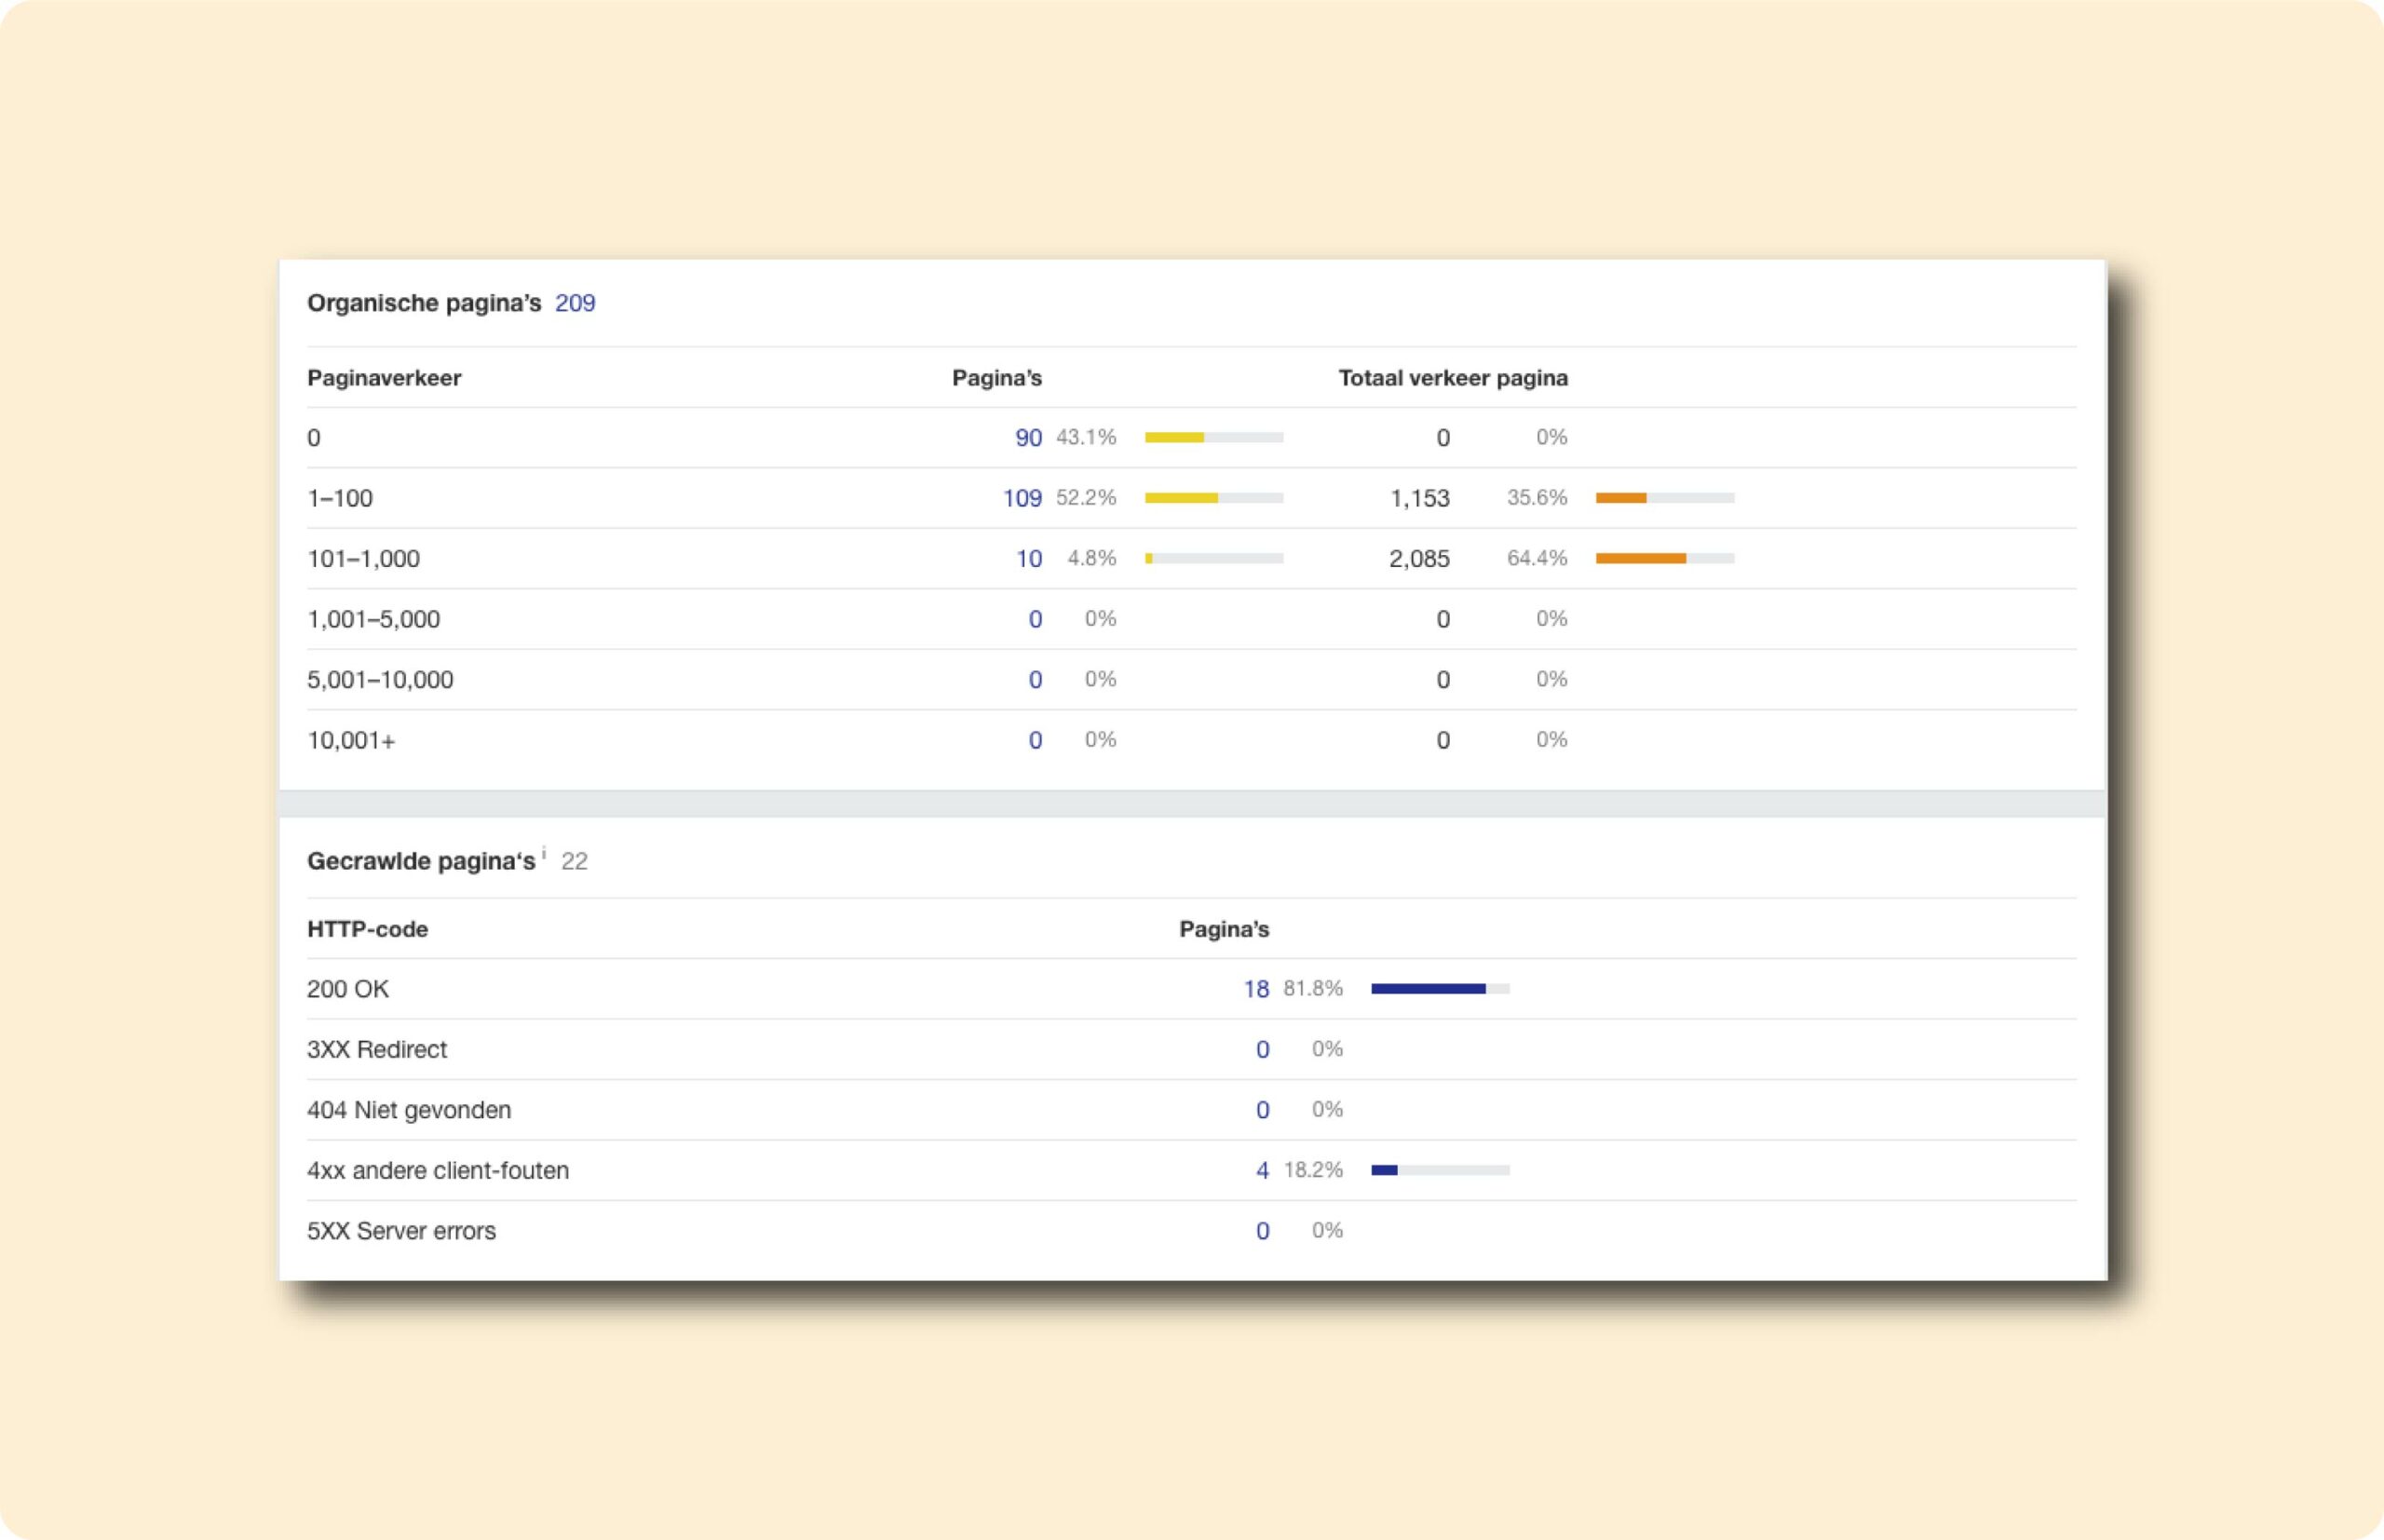
This section features the following:
- A column with the number of pages where in can be seen how many of these pages receive 0, 1-100, 101-1000 or more traffic. This is a useful overview for content pruning. Especially the overview with 0 organic traffic and 1-100 will help.
- The number of pages crawled along with a status code per page. Note, I personally would use Google Search Console for this rather than this overview. But it is still interesting for certain insights (in a smaller / less thorough format).
Summary
I am often in the Site Explorer. I personally use it mainly for determining the current SEO value of websites and then when I need to dive into this more thoroughly.
Use Site Explorer as an initial overview (a kind of dashboard) of a Web site’s well-being and performance. Then you can click through to the appropriate reports via plenty of avenues.


